
This year average winter wheat yields were reported at between 7.8–8.2t/ha, slightly down compared to last year which was 8.4 – 8.6t/ha. Specific weight values from our data is variable, with wider industry data suggesting a slight decrease compared to 2022 at 73-75kg/hl (AHDB 2023 Report #6).
As stated in our interim harvest report, early indications suggested that protein is down this year compared to last, and previous years. Our data also agrees with this trend, showing that protein is slightly lower than last year. Our results show wheat protein averaging at 9.80% (excluding Scotland) on an ‘as is’ basis shown in Figure 1. It is possible that further decrease in protein from last year could be due to the wet spells we experienced sporadically throughout summer as heavily saturated soil could reduce nitrogen uptake. Could lower protein wheat be the new normal?
Figure 1. Wheat crude protein levels (moisture as is) based on wet chemistry (excluding Scotland) - Premier Nutrition survey results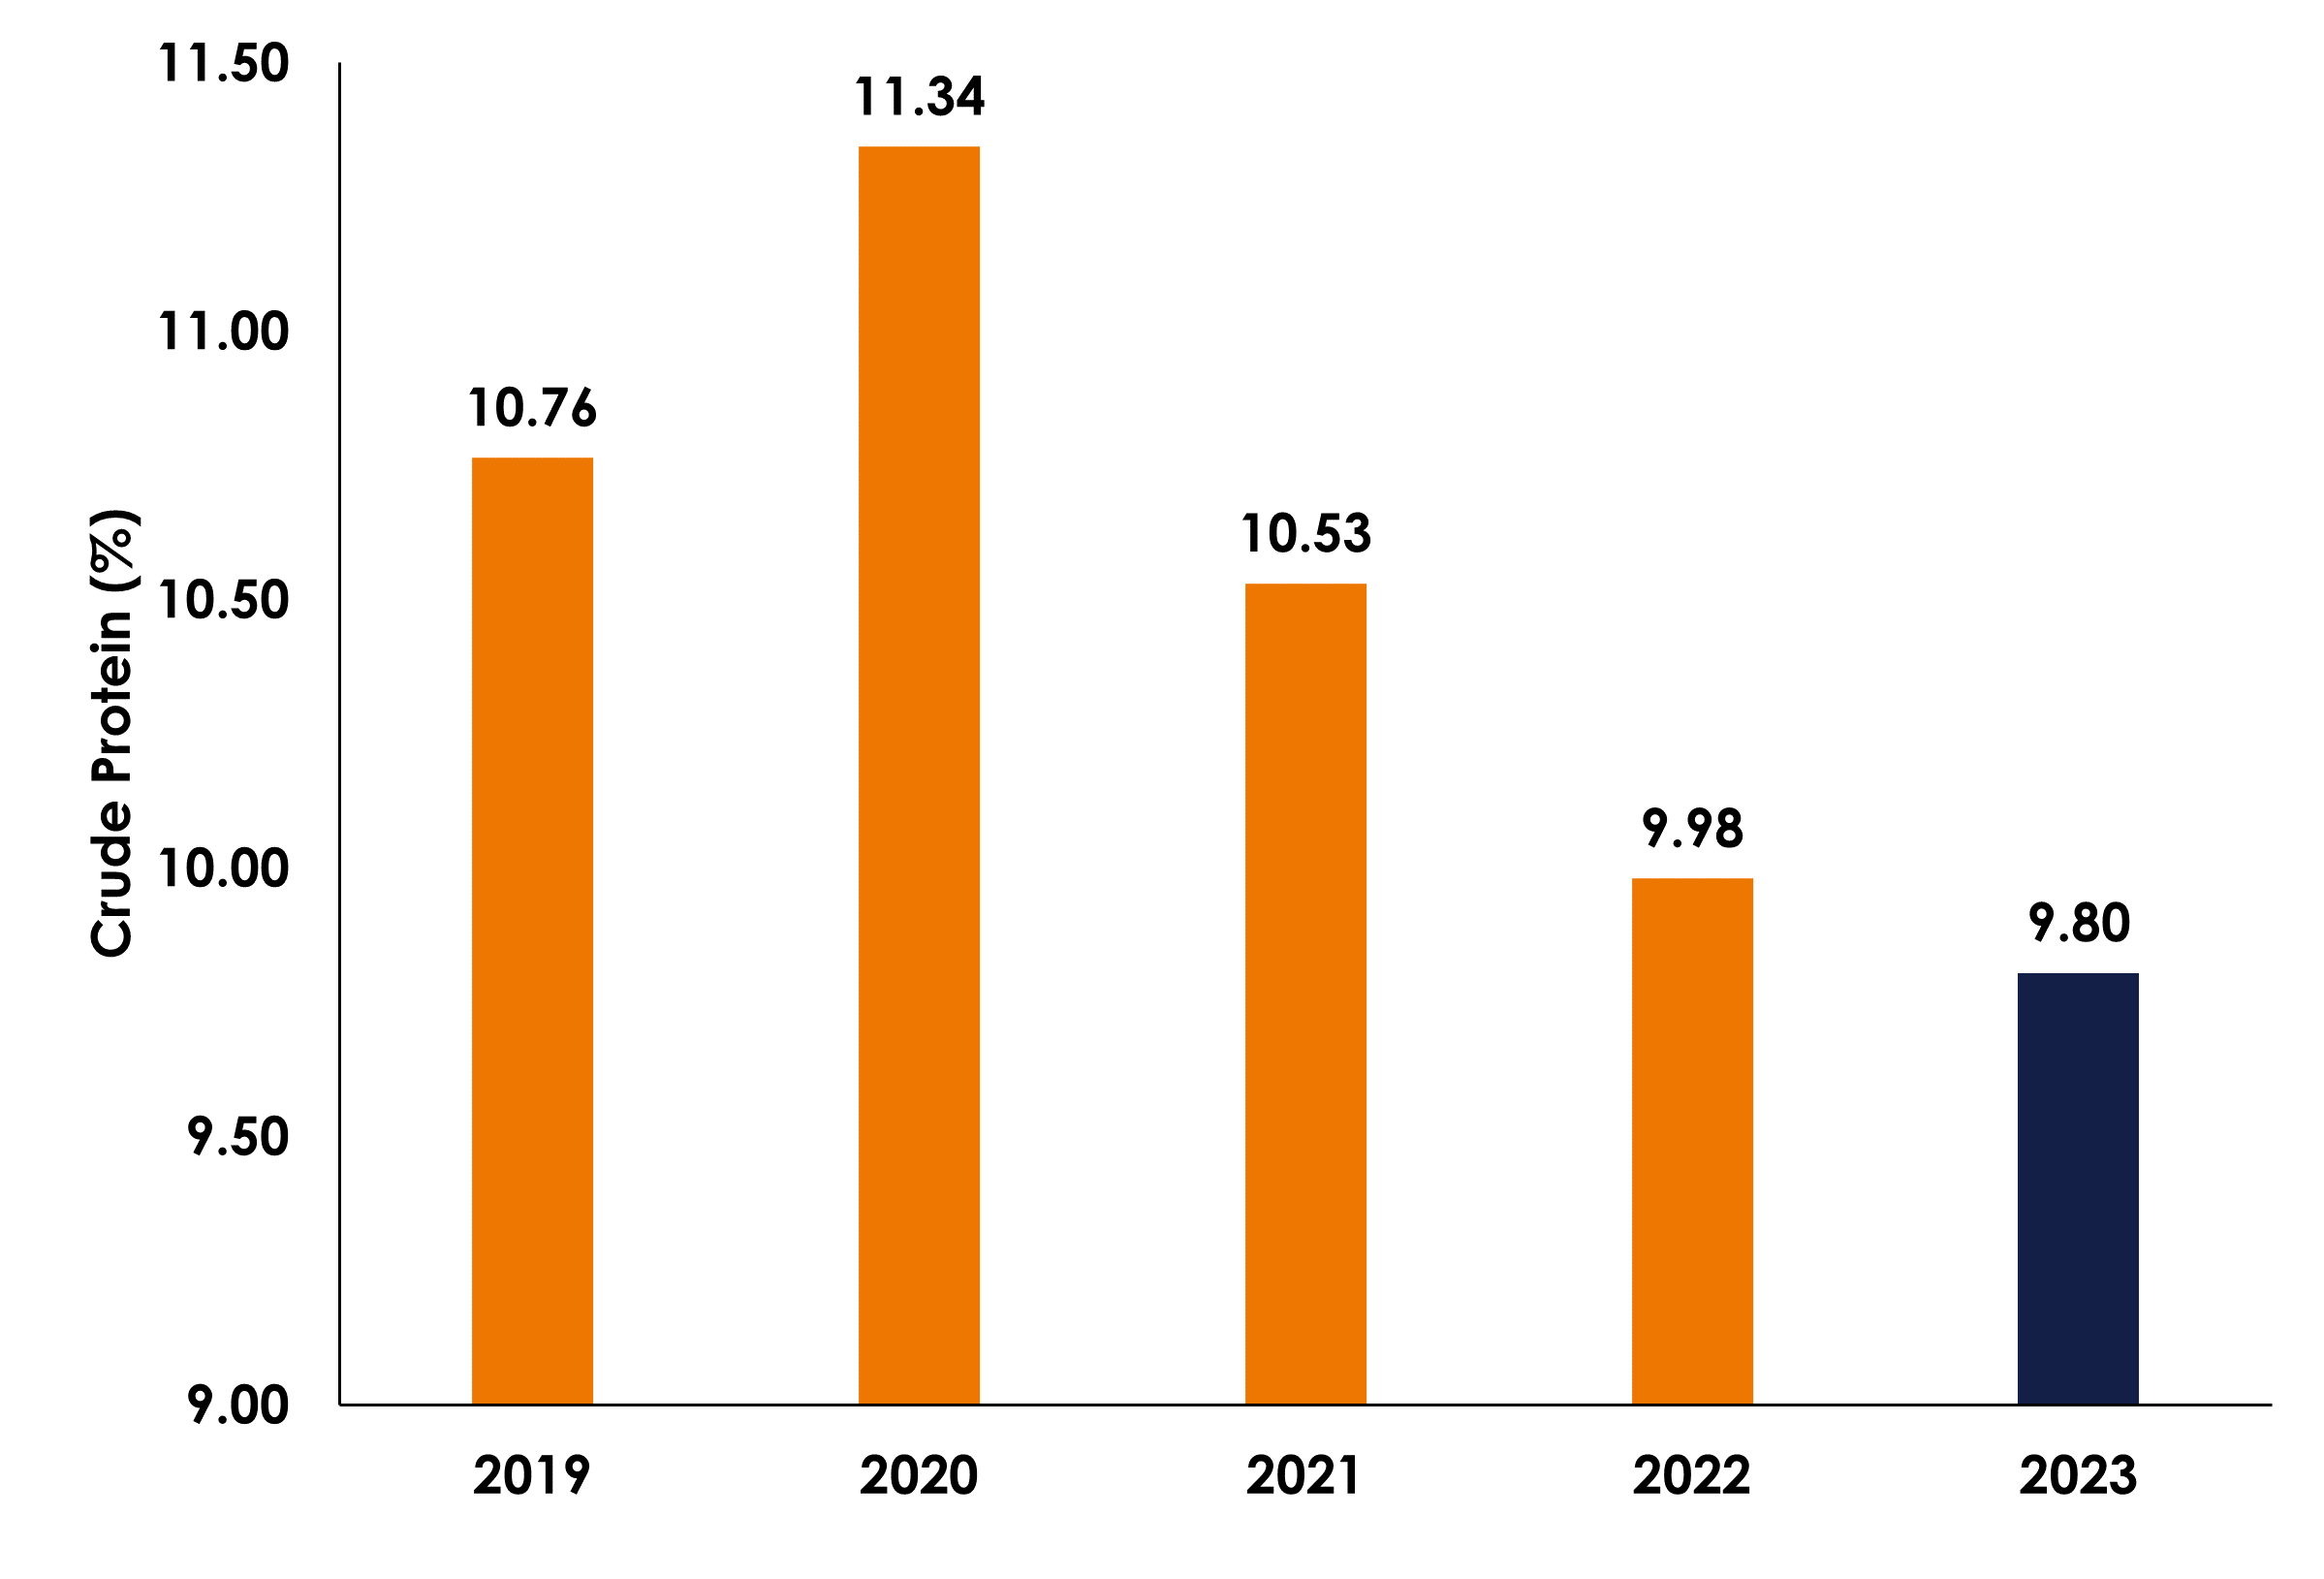
Regional variation and yearly change of protein is shown in Table 1. All regions other than Central and West/North West showed a reduction in protein compared to last year. The East/Lincolnshire region is where the biggest average year to year change was shown with a reduction of 0.8%.
The lowest regional average wheat protein was in Scotland at 9.0%. Overall, 2023 average wheat protein per region did not pass higher than 10%, with the lowest and highest value wheat protein seen in the West/North West region of 7.8% and 13.4% respectively. Due to the wide variation seen within our results within and between regions, the importance of analysing your own cereals becomes crucial for providing the most accurate feed value for these grains.
Table 1: Regional changes in protein (%) content of wheat (moisture as is) based on wet chemistry - Premier Nutrition survey results. 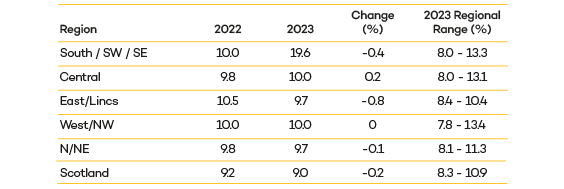
Wheat moisture content in 2023 was higher than that of 2022 due to the high temperatures and heat waves experienced last year and the increased rainfall this year. Compared to the 5-year average, 2023 wheat moisture content is also slightly higher but near similar levels as previous years (see Figure 2). Both the highest and lowest moisture levels were recorded in the North/North East at 16.4% and 9.1%.
Regionally, no average moisture content was below 13% this year except Scotland which showed a regional average of 12.9%. On average, the wettest regions were the South/South West/South East and West/North West at 13.9% moisture content. The variation seen in our results is likely to be influenced due to some samples being submitted for analysis post-drying.
Figure 2: 5-year average wheat moisture content (2019-2023) (excluding Scotland) - Premier Nutrition survey results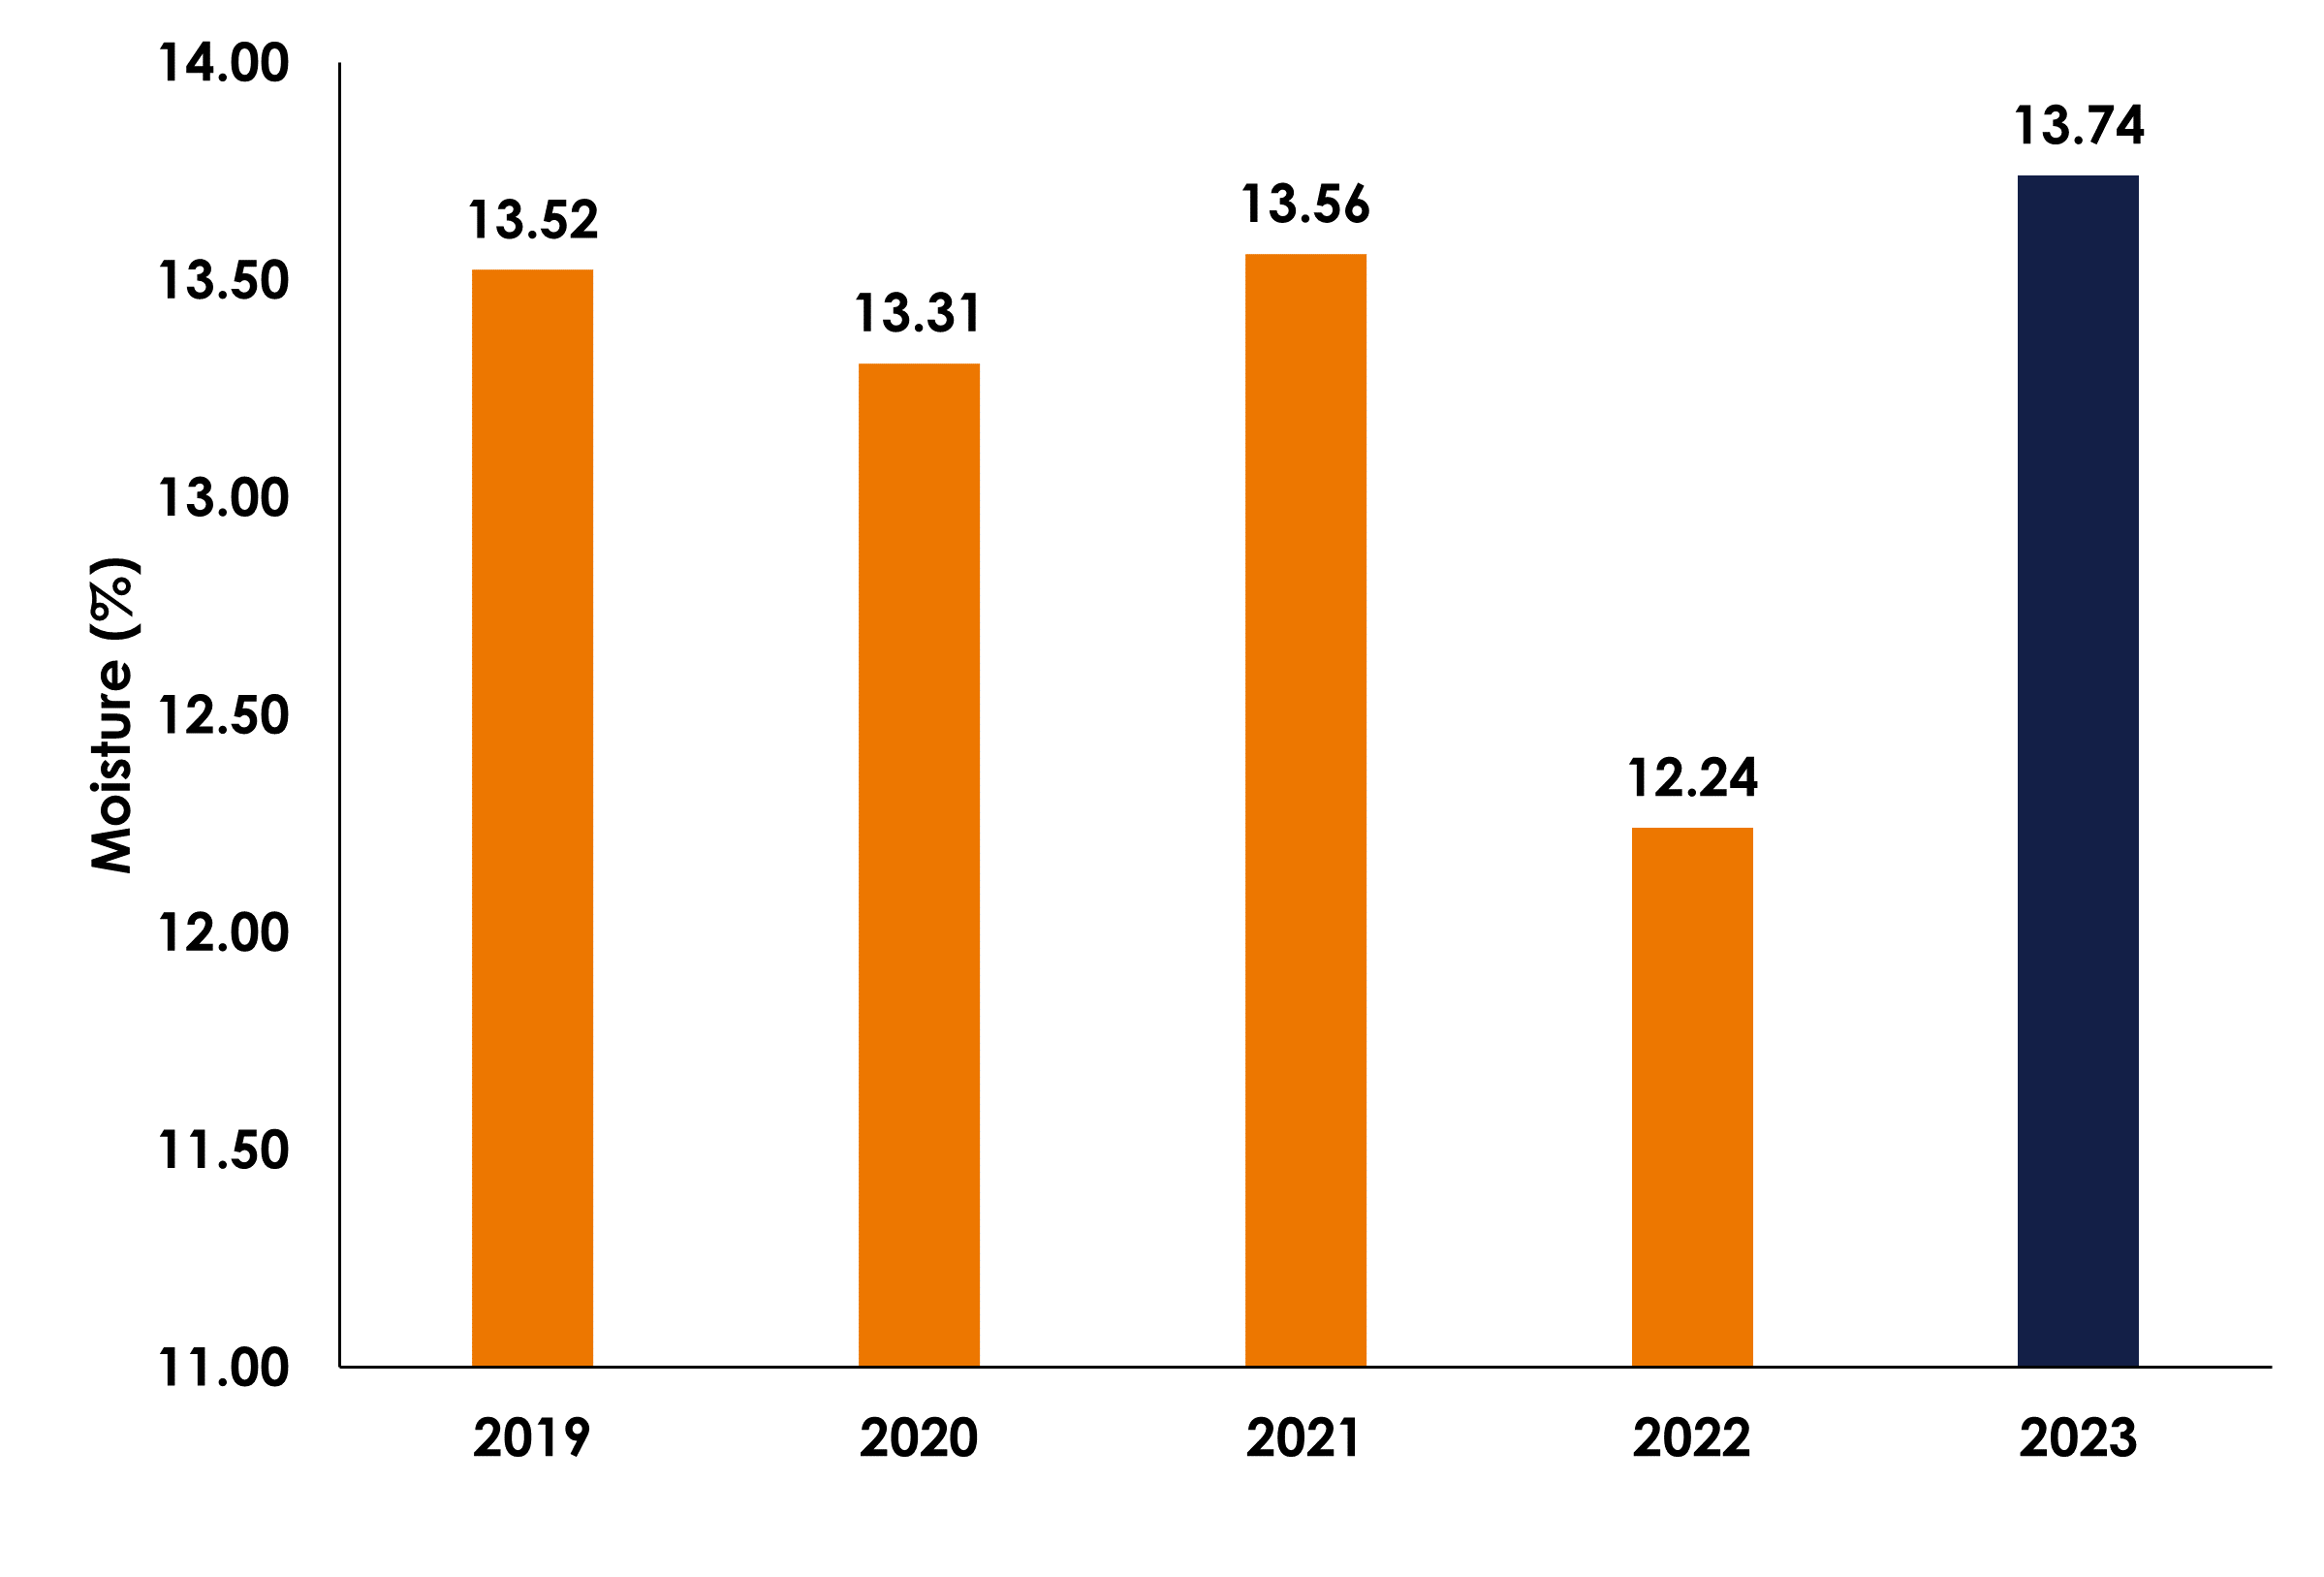 Calculations using the WPSA equation shows wheat energy values have decreased slightly (-0.2 MJ/kg) since last year on an ‘as is’ basis, although similar to 2021. This is primarily due to the exceptional low moisture of wheat in 2022 as, when corrected to moisture at 13.50%, energy levels are comparable to last year (+0.02 MJ/kg) (Table 2).
Table 2: AMEn values for wheat between 2019 and 2023 calculated using the WPSA energy equation (excluding Scotland) 
Similar to wheat, average winter barley yields were down compared to last year at 6.8 - 7.2t/ha compared to 2022 values of 7.2–7.4t/ha, although in line with the 5-year average. Spring barley yield ranges were also lower than last year at 5.2 - 5.5t/ha compared to 5.7 - 6.1t/ha and below the previous 5-year average of 5.8t/ha reported by AHDB. Barley specific weights are variable ranging from 63-65kg/hl for winter barley, and 59-62kg/hl for spring barley (AHDB 2023 Report #6).
Barley samples received from our survey indicate average protein to be 9.25% on an ‘as is’ basis (excluding Scotland), slightly higher than 2022 which showed 9.21% (Figure 3). As with wheat, barley protein has also been trending down over the last 5 years. Regional variation showed that the highest result of 12.3% was from the Central region and the lowest result of 6.9% from the South/South West/South East. The East/Lincolnshire region showed the lowest average barley protein at 8.5%, with the highest average of 10% from the Central region.
Figure 3. Barley crude protein levels (moisture as is) based on wet chemistry (excluding Scotland) - Premier Nutrition survey results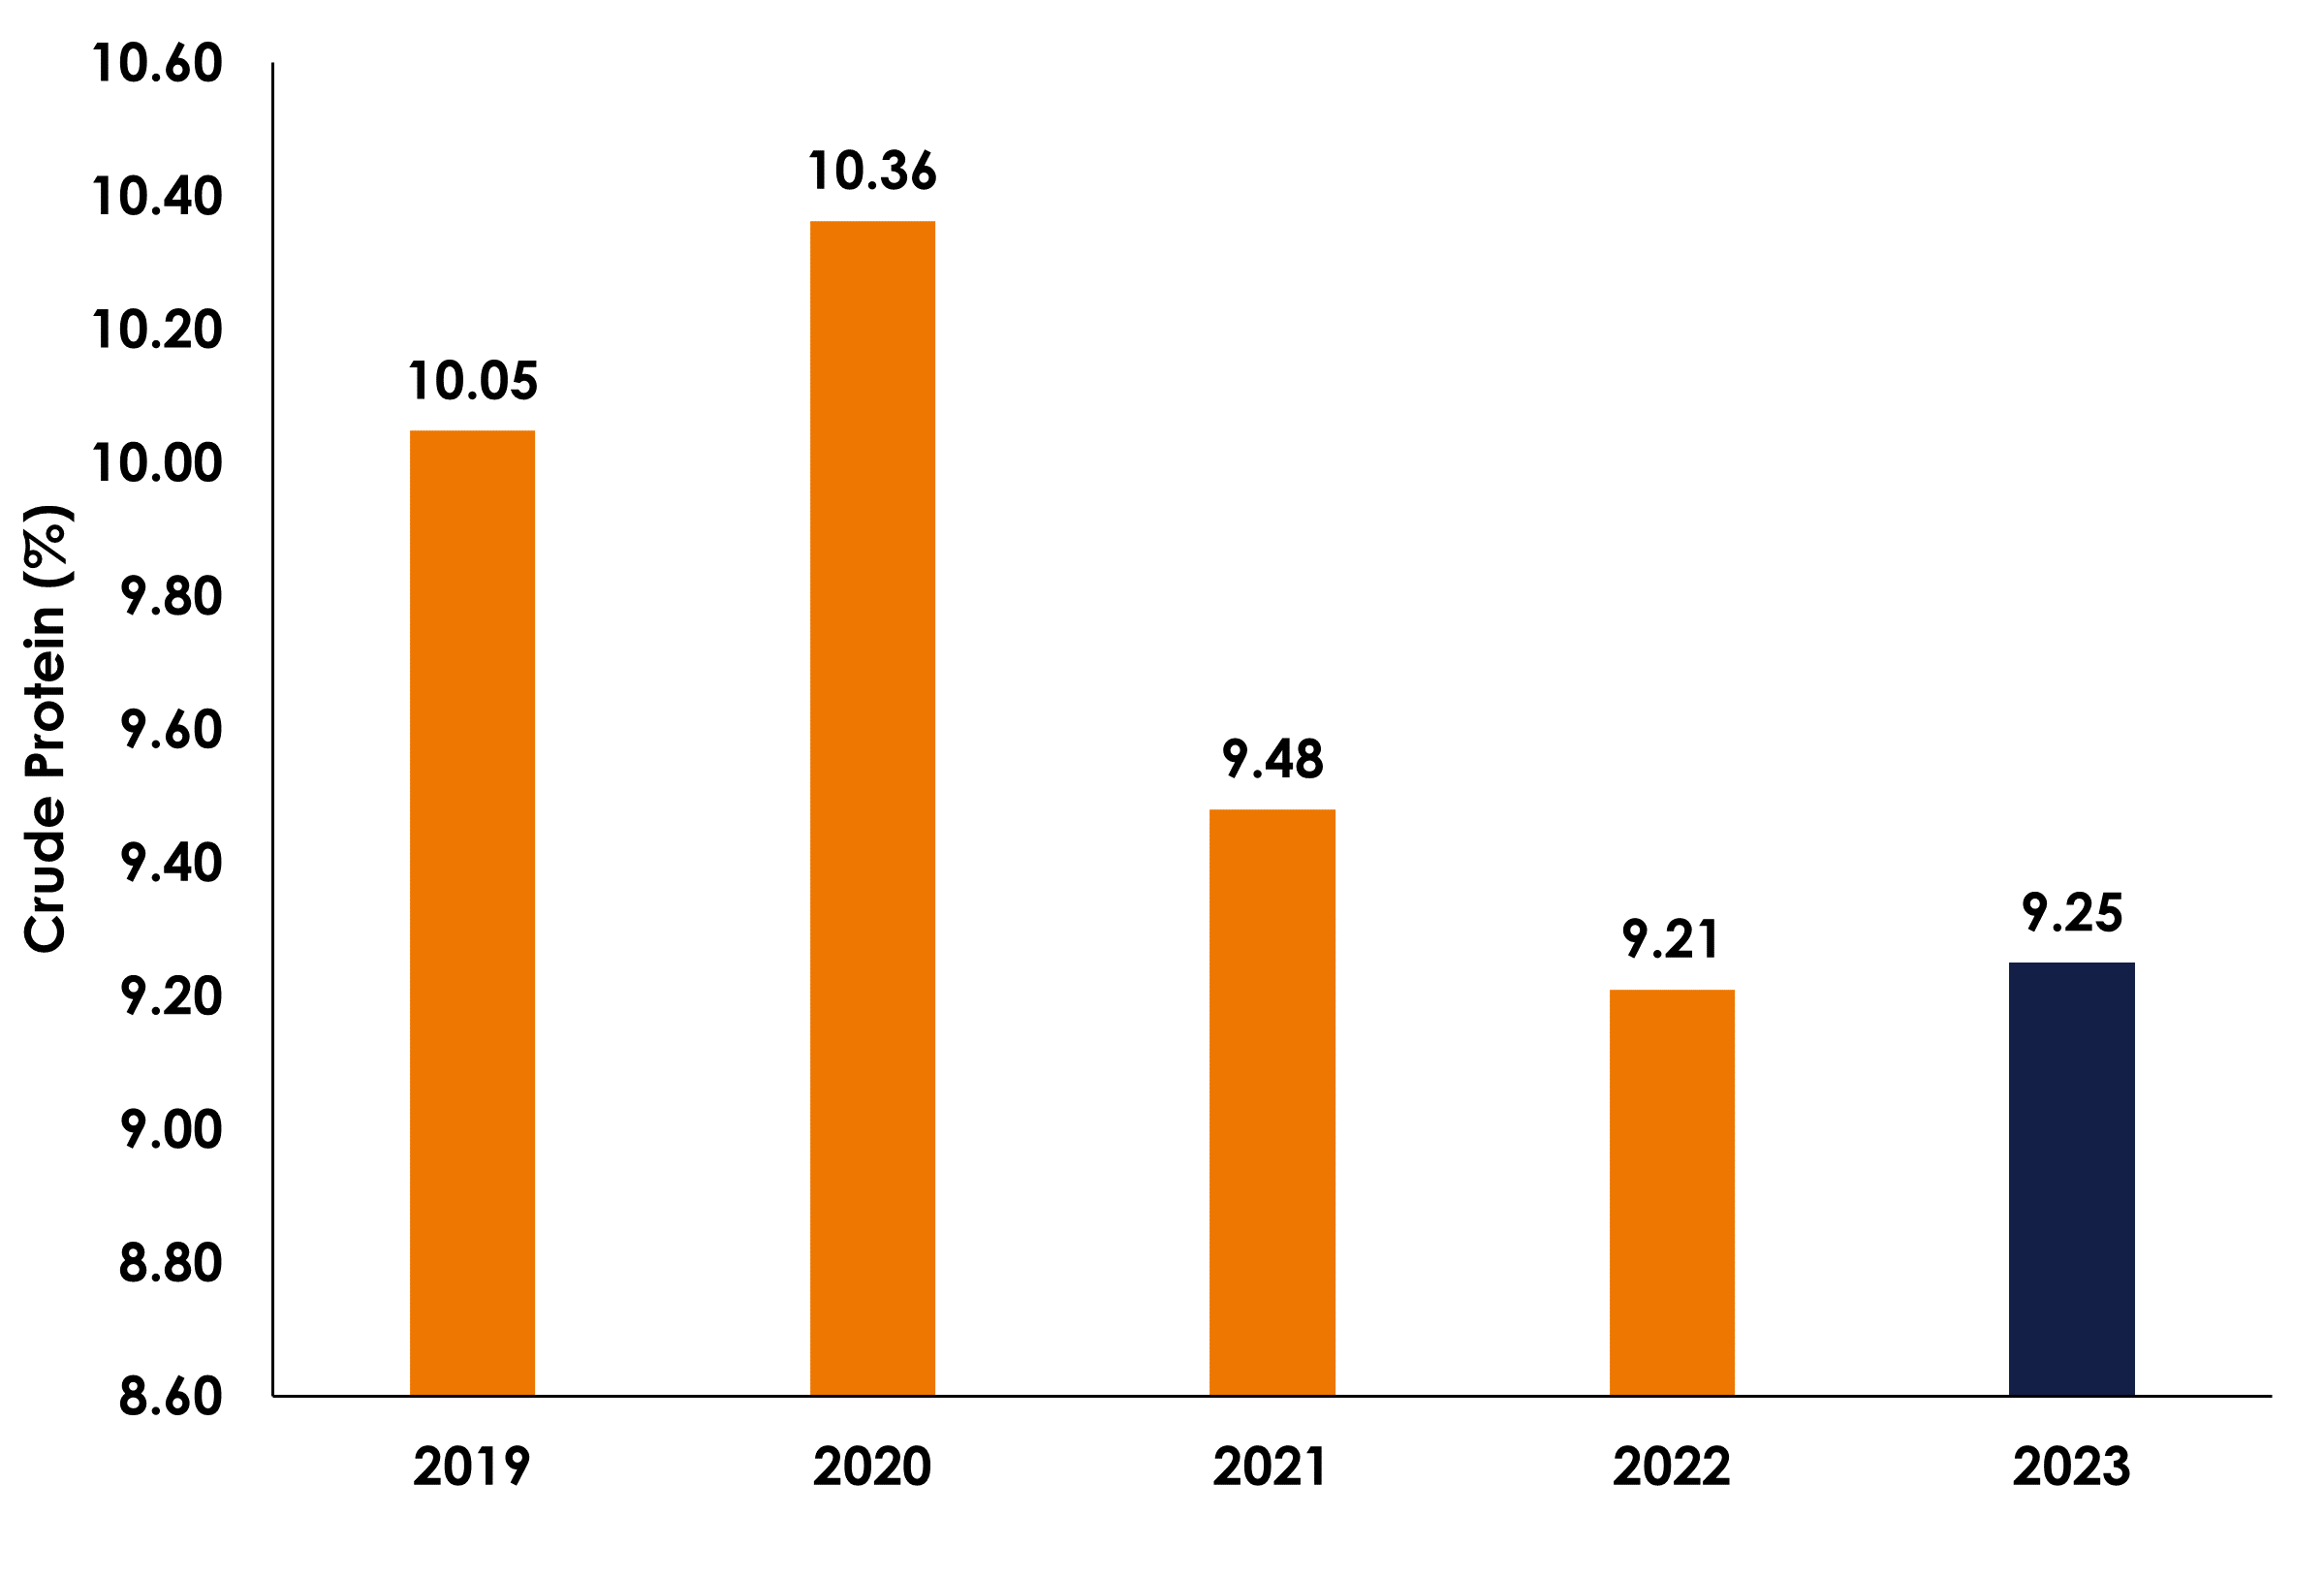
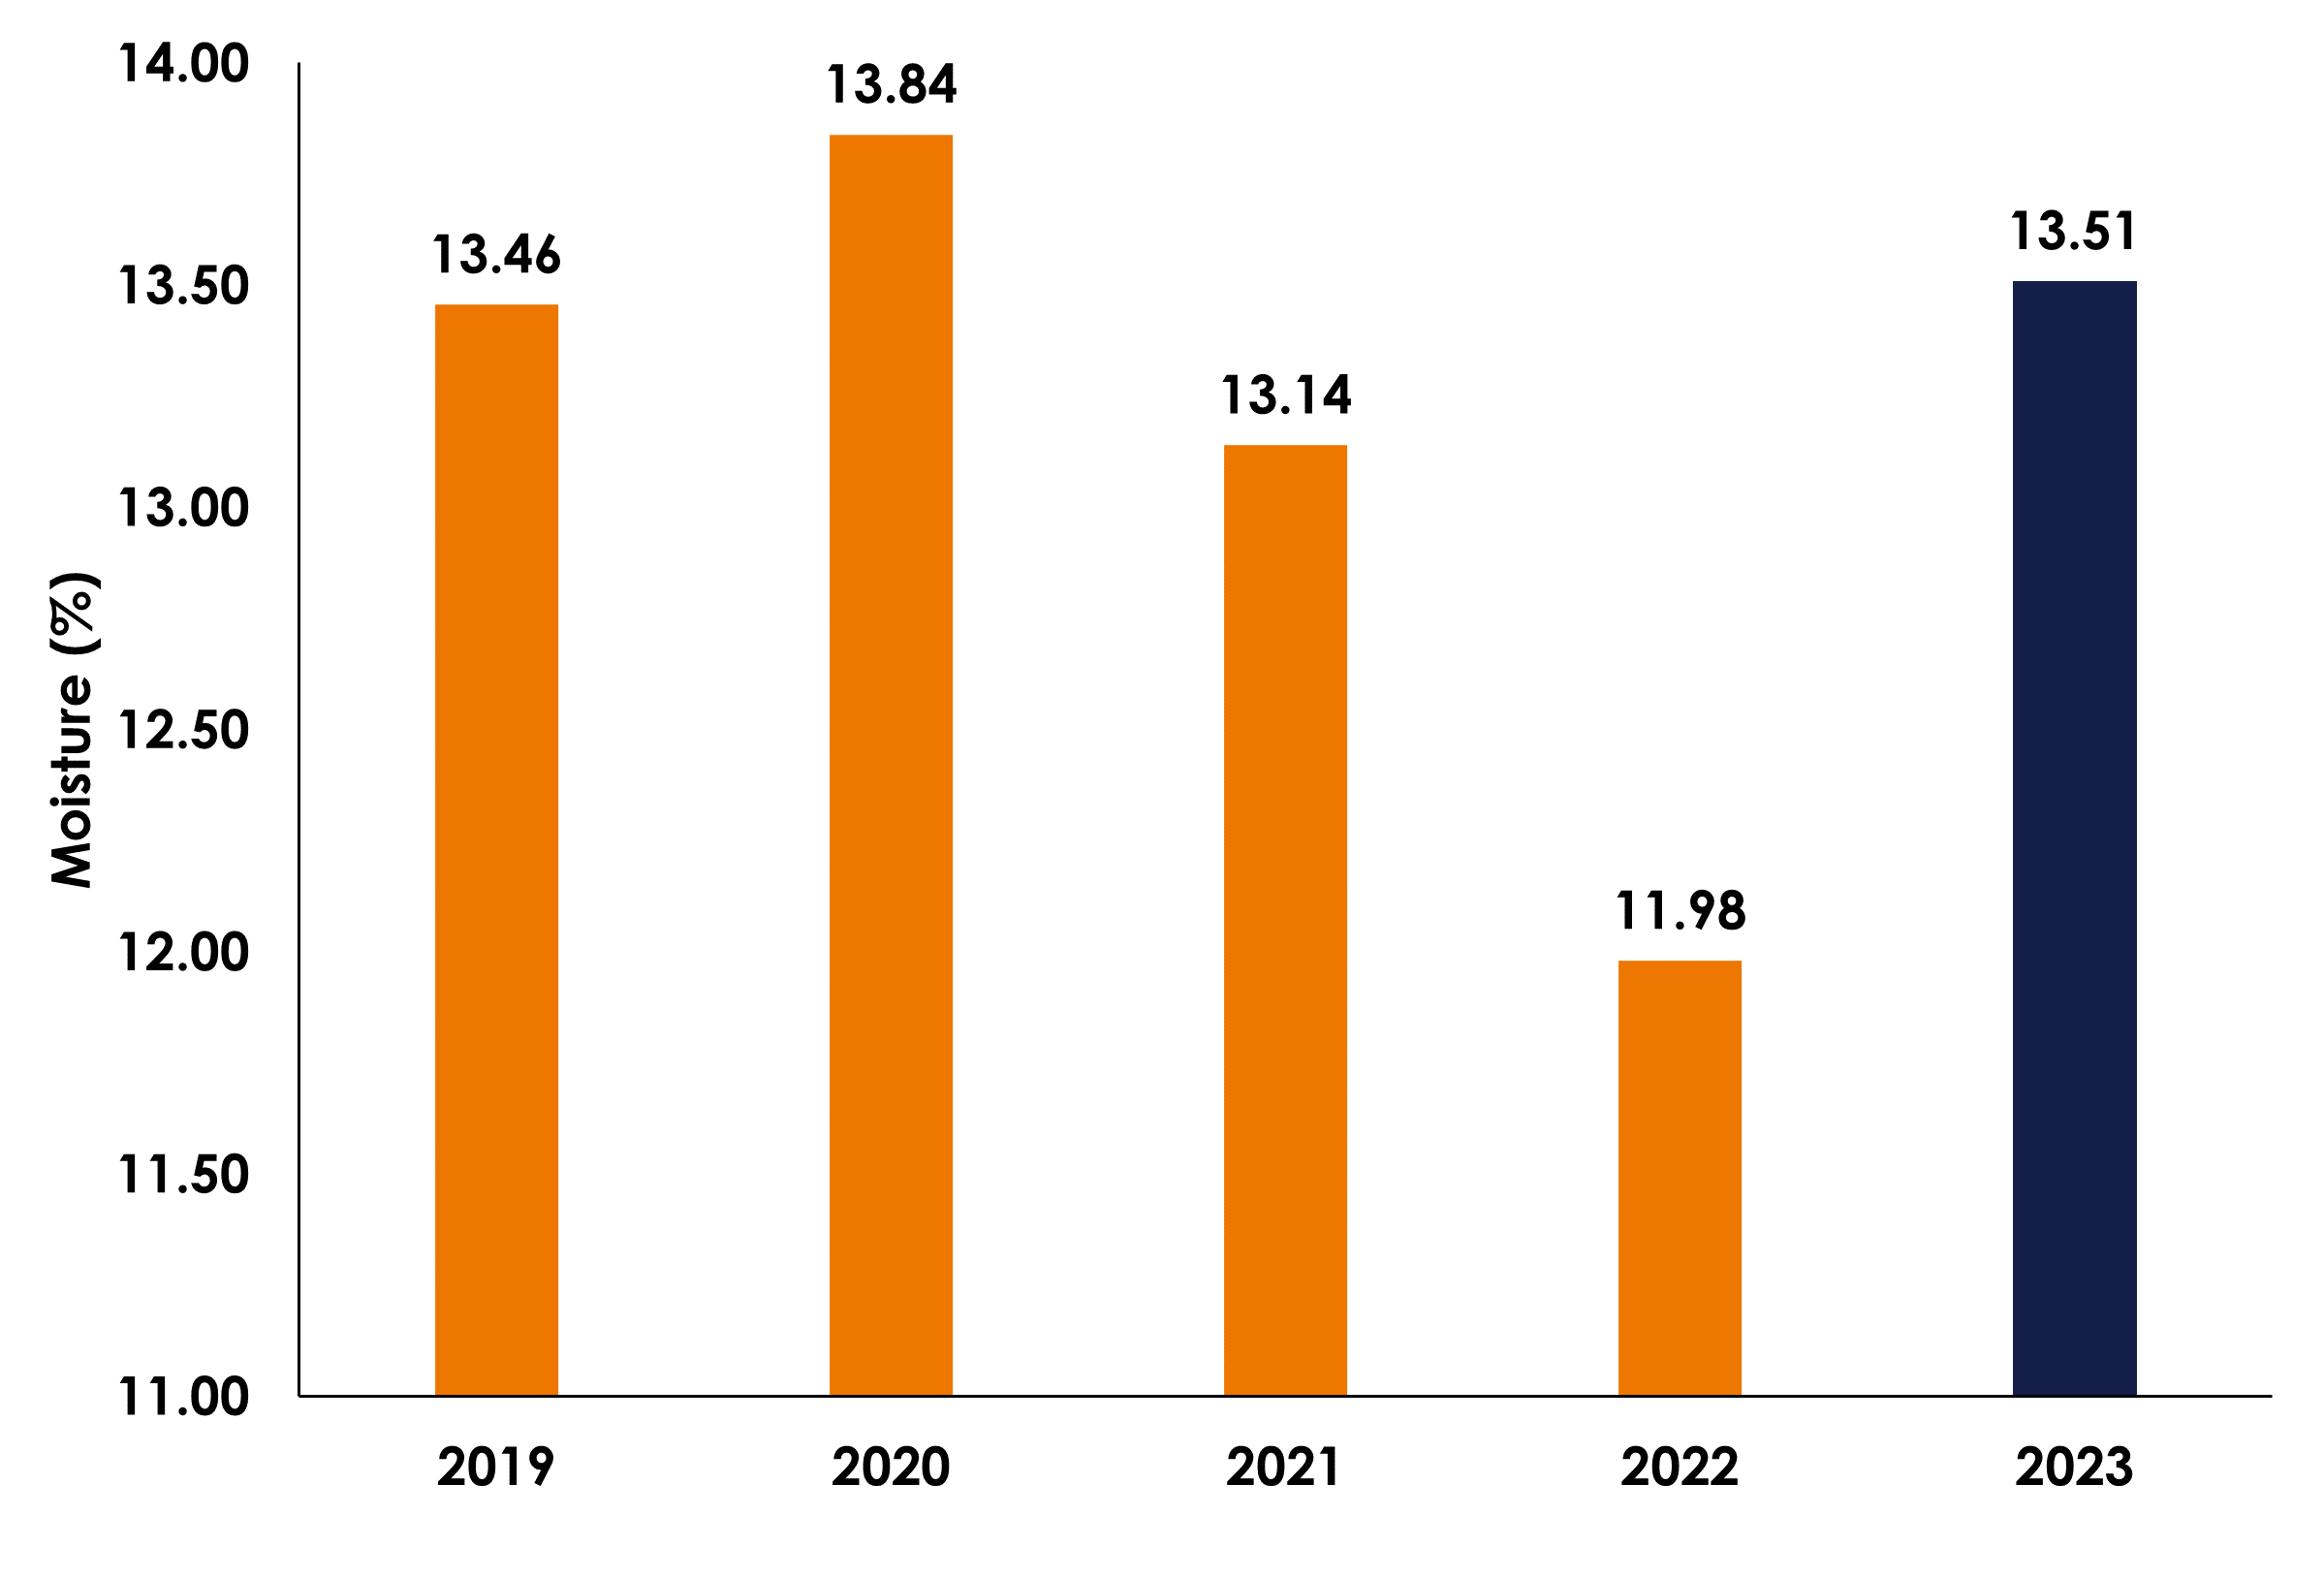
Moisture content for barley also followed the same trend as wheat, being higher than the previous year, but in line with 2019-2021. This year’s average barley moisture content was recorded at 13.51%, an increase of 1.53% compared to 2022 (Figure 4).
Figure 4. 5-year average barley moisture content (2019-2023) (excluding Scotland) - Premier Nutrition survey results
When calculating AMEn for barley using the WPSA energy equation, energy values for 2023 were lower than 2022, although comparable to 2021, on both an ‘as is’ basis and when corrected for moisture at 13.50% as seen in Table 3.
Table 3: AMEn values for barley between 2019 and 2023 calculated using the WPSA energy equation (excluding Scotland) 
In general, mycotoxin risk is relatively low, despite the wetter conditions this year compared to 2022. However, some localised regions carry higher risk than others for specific mycotoxins in both wheat and barley.
Overall, reports of ergot have been low this year although there have been a number of reports within the Central region in both wheat and barley.
Results observed within our sample set and similar data from across the industry highlights the need for ongoing local analysis to ensure that the most reliable information is used when updating matrix values as variation is seen within our sample set as well as other industry data.
Summary tables of proximate analysis and expected amino acid profiles of wheat and barley split by geographical region can be requested by emailing poultry@premiernutrition.co.uk.
Finally, we would like to acknowledge the support of our customers and thank them for providing the samples that form the basis of this 2023 survey.